Cambridge Population Trends - miscellany
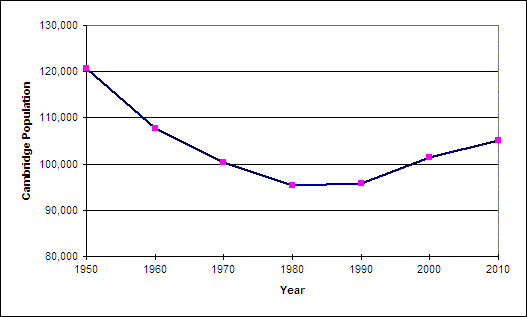
March 22, 2011 - The 2010 Census data is now available. The population of Cambridge grew over the last decade, but apparently not as fast as the previous decade and not as much as many had predicted.
| Year | Population | % Change |
Household Population |
Group Qtrs. Population |
% Living in Group Qtrs. |
Dormitory Residents |
|---|---|---|---|---|---|---|
| 1950 | 120,740 | -- | 107,676 | 13,064 | 10.8% | -- |
| 1960 | 107,716 | -10.79% | 95,778 | 11,938 | 11.1% | -- |
| 1970 | 100,316 | -6.87% | 88,502 | 11,859 | 11.8% | -- |
| 1980 | 95,322 | -4.98% | 82,888 | 12,434 | 13.0% | 10,854 |
| 1990 | 95,802 | 0.50% | 81,769 | 14,033 | 14.6% | 11,931 |
| 2000 | 101,355 | 5.80% | 86,692 | 14,663 | 14.5% | 13,199 |
| 2010 | 105,162 | 3.76% | -- | -- | -- | -- |
| Note: Residents of Group Quarters include residents of college dormitories, hospitals, nursing homes, group homes and jails. All persons who do not reside in group quarters reside in households. Dormitory residents refers to college dormitory residents, a subgroup of group quarters residents. |
||||||

From: Brian P. Murphy, Assistant City Manager for Community Development
Date: March 29, 2011 (for Apr 4, 2011 City Council meeting)
Subject: Council Order #10 of March 7, 2011 regarding demographic and population trends
In response to the above referenced order we report the following:
Population projections for Cambridge are available from various sources.
The Metropolitan Area Planning Council (MAPC) prepares projections of population, households, and employment as part of its long range planning activities. While Community Development staff provides assistance to MAPC prior to preparation of that organization's projections, they are prepared entirely by MAPC for that organization's use. The most recent iteration ofthe MAPC projections was released earlier this month to support development of Paths to a Sustainable Region 2035, the Boston Metropolitan Planning Organization's long-range transportation plan. The most recent MAPC projections for Cambridge follow:
| Year | Population | Households | Employment |
| 2010 (MAPC Projection) | 109,474 | 46,130 | 103,015 |
| 2020 (MAPC Projection) | 115,407 | 49,279 | 114,280 |
| 2030 (MAPC Projection) | 121,531 | 52,694 | 119,914 |
| 2035 (MAPC Projection) | 123,300 | 53,537 | 119,953 |
Projections can also be purchased from commercial sources, such as Claritas/Neilson and Geolytics. The Community Development Department does not prepare projections of demographic and population trends.
Earlier this month the U. S. Census Bureau released population counts for Massachusetts cities and towns. While these counts do not include projections, they will serve as the basis for future projections undertaken by various organizations.
Recent Census counts for Cambridge:
| Year | Population | Households | Employment |
| 2000 (US Census) | 101,355 | 42,787 | -- |
| 2010 (US Census) | 105,162 | 44,032 | -- |
The recently released population counts do not contain detailed information, such as age by cohorts, that would be helpful in understanding who lives in Cambridge. That information will be released later this spring. Over the summer, CDD staff will analyze this data and will present it to the City Council in the fall.
Racial Composition of Cambridge Population
| Cambridge | Population | % change | White | % | Black | % | Asian1 | % | Other2 | % | Hispanic3 | % |
1950 |
120,740 | -- | 115,068 | 95.3% | 5,235 | 4.3% | -- | -- | 437 | 0.4% | -- | -- |
| 1960 | 107,716 | -10.79% | 100,929 | 93.7% | 5,671 | 5.3% | -- | -- | 1,116 | 1.0% | -- | -- |
| 1970 | 100,361 | -6.87% | 91,408 | 91.1% | 6,783 | 6.8% | 1,465 | 1.5% | 705 | 0.7% | -- | -- |
| 1980 | 95,322 | -4.98% | 78,460 | 82.3% | 10,418 | 10.9% | 3,612 | 3.8% | 2,832 | 3.0% | 4,536 | 4.8% |
| 1990 | 95,802 | +0.50% | 72,122 | 75.3% | 12,930 | 13.5% | 8,081 | 8.4% | 2,669 | 2.8% | 6,506 | 6.8% |
| 2000 | 101,355 | +5.80% | 69,022 | 68.1% | 12,079 | 11.9% | 12,113 | 12.0% | 8,141 | 8.0% | 7,455 | 7.4% |
| 2010 | 105,162 | +3.76% | 70,006 | 66.6% | 12,253 | 11.7% | 15,879 | 15.1% | 7,024 | 6.6% | 7,974 | 7.6% |
1. Includes persons of Asian or Pacific Islander descent, who were included in "Other" category prior to 1970.
2. Includes persons of Native American descent, as well as persons who report their race as "Other". For 2000 Census, includes persons who selected two or more races. Census 2000 was the first census to allow persons to report more than one race. Due to this change in methodology, racial statistics reported from Census 2000 lack a one-to-one comparison with those reported by any previous Census.
3. Figures do not sum to total population. For 1980 and 1990 both American Indian persons of Hispanic origin and Asian persons of Hispanic origin are double counted. For 2000 Asian persons of Hispanic origin are double counted.
Note: Some people in the 2010 Census chose to leave blank one of both questions regarding race and Hispanic origin. It is unclear how this factors into the data shown above, though these respondents may be includes in the "Other" category.
Sources: Cambridge Community Development (from U. S. Census, Decennial Census, STF1A tape file, 1980; STF1A tape file, 1990; Summary File 1, 2000); recent news reports of 2010 Census in Cambridge Chronicle and elsewhere. Corrections and additional information are welcome.