City Manager Letter on the FY10 Tax Rate
September 21, 2009
To The Honorable, the City Council:
The establishment of the FY10 property tax rate by the Board of Assessors, subject to the approval of the Massachusetts Department of Revenue is the final step in the annual fiscal process that begins in the Spring of each year with the submission of the annual budget to the City Council. With this memo, I am transmitting to you my recommendations for the required votes necessary to minimize taxes on residential properties. In addition, you will find analyses of the FY10 property tax levy, property values and other supporting information.
OVERVIEW
I am pleased to inform you that the actual FY10 property tax levy of $268,662,984 reflects a $13,717,406 or 5.38% increase from FY09. The FY10 Budget adopted by the City Council in May 2009 projected a property tax levy increase of $15.3 million or 5.98% to $270,199,590 in order to fund operating and capital expenditures. The FY10 operating budget reflects a 2% increase, which is the smallest increase in several years.
At that time, I informed the City Council that the actual tax levy increase was likely to change. This was based on potential changes in State Aid that would not be known until the State finalized its FY10 budget and the possible use of additional non-property tax revenues that would be available based on FY09 actual collections as well as opportunities for new local option revenues based on changes to current State statutes.
These assumptions proved correct. The Adopted FY10 City Budget used the Governor's recommended State Aid amounts which were reduced by $2 million during the State budget process. The Adopted State Budget provided cities and towns in the Commonwealth the opportunity to replace some or all of their loss in State Aid by allowing, for the first time, an allocation of 0.75% of the Meals Excise upon local acceptance for local use, and has allowed a local option of increasing the Room Occupancy Excise by 2%. The City Council adopted both these options on July 27, 2009. Overall, the City is estimating it will realize approximately $2.7 million in FY10 from these two local option excises. This has allowed the $2 million in reduced State Aid to be recovered from these revenue sources.
Also, the use of additional non-property tax revenue and other adjustments has allowed an overall reduction of $1,536,606 from the original projected property tax levy. This is possible due to use of increased non-property tax revenues, such as the $700,000 from the local option excises (over and above the $2.0 million noted above), Free Cash ($500,000) and Parking Fund revenues ($158,191). Also, included is $137,016 in overlay adjustments and $41,399 in Cherry Sheet net savings. This resulted in a final property tax levy for FY10 of $268,662,984, an increase of 5.38%. With approval of these recommendations, the five-year average increase in the property tax levy will be 3.8%. This fact should be emphasized, insofar as the City received an overall decrease in State Aid of $9.7 million. The impact of the decrease in State Aid is the major factor creating the disparity between the percentage of budget increase and percentage of property tax levy increase.
|
Tax Levy Changes |
Amount |
|
State Aid Adj. -Revenues and Assessments (Actual) |
+$1,958,601 |
|
Non-Property Tax Revenue |
-$3,358,191 |
|
Overlay Adjustment |
-$137,016 |
|
Net Decrease |
- $1,536,606 |
This recommendation includes the use of $11 million in reserve accounts to lower the property tax levy; $2 million from overlay surplus; and $3 million in Free Cash, which is an increase of $500,000 over the amount used in the FY10 Adopted Budget, as anticipated revenue source; plus an additional $6 million from Free Cash. Also, $8 million from the Debt Stabilization Fund and $2.8 million from the School Debt Stabilization Fund is used to offset increases in debt service costs that would otherwise have been funded from property taxes.
This strategy of using an increased amount of non-property tax revenues and reserves to lower property taxes will not jeopardize our long-term fiscal health. However, if the City used all of its reserves in one year to artificially reduce property taxes it would mean that in the following year the City would be required to either increase taxes significantly, since the reserves would no longer be available, or dramatically reduce expenditures (services). The City's prudent and planned use of its reserves has been positively recognized by the three major credit rating agencies and is reflected in our AAA credit rating.
Based on a property tax levy of $268.7 million, the FY10 residential tax rate will be $7.72 per thousand of value, which is an increase of $0.16, or 2.1% from FY09. The commercial tax rate will be $18.75, which is an increase of $0.78, or 4.3% from FY09.
However, approximately 80.5% of residential taxpayers will see a reduction, no increase or an increase of less than $100 in their FY10 tax bill, which is greater than our fourth year annual average and has occurred during a year of tremendous fiscal turmoil. This will be the fifth year in a row that a substantial majority of residential tax payers will see either a reduction, no change or an increase of less than $100.
TABLE I
Change in the Residential Tax Bills*
|
Change in Tax Payment |
Number of Parcels |
Percentage |
|
Less than $0 |
716 |
3.6% |
|
> $0 and less than $100.00 |
15,518 |
76.9% |
|
>$100.00 less than $250.00 |
2,725 |
13.5% |
|
>$250.00 and less than $500.00 |
783 |
3.9% |
|
Greater than $500.00 |
427 |
2.1% |
|
Totals |
20,169 |
100% |
* Based on Single, Two, Three Family and Condominiums and assumes the Residential Exemption for each parcel in both years.
MEDIAN TAX BILLS
The analysis below explains in further detail how the City determines property values and property tax rates for FY10.
There are three major factors which determine a property tax bill. These factors are: The Budget, Commercial-Residential Property Tax Classification and Property Values. As discussed below, all three factors contributed to lower tax bills for many homeowners.
The Budget: If the City Council adopts the proposed recommendations, there will be 5.38% increase in the property tax levy required to balance the FY10 Budget. The FY10 property tax levy increase reflects the $9.7 million reduction is State Aid. In addition, the FY10 Adopted Budget reflected a 2% increase which supports the City Council Goal of “evaluating expenditures with a view of maintaining a strong fiscal position and awareness of the impact on taxpayers.”
Commercial-Residential Property Tax Classification: Tax classification allows municipalities to tax commercial taxpayers at a higher rate than residential taxpayers. In FY10, commercial property owners will pay 65.4% of the property tax levy, an increase from the 65.0% share in FY09. Consequently, residential property owners' share of the FY10 tax levy is 34.6%, down from 35.0% in FY09.
Property Values: Every January 1st, the City of Cambridge must meet Department of Revenue requirements to certify that property values represent full and fair market value. Based on market activity in calendar year 2008, which is the basis of the FY10 property assessment, increases in total residential property values have moderated (approximately 1.7% increase overall). Increases in total commercial property values have also moderated and have increased by 1.6%. The majority of the increase in residential property values is due to new construction, while maintaining the value base in commercial property values is also due to new construction. These factors, coupled with the City's improved ability to analyze and incorporate adjustments to residential values using the mass appraisal model, have allowed the City to make changes to various assessment districts.
The chart below shows the change in the median tax bills by property class. It is important to note that while the overall total residential assessed value increased in FY10, assessed values of existing homes remained relatively stable. The median value is the mid-point value, which has an equal number of values below and above it.
TABLE II
Change in the Median Value and Tax Bill by Property Class*
| FY09 Value | FY09 Tax Bill | FY10 Value | FY10 Tax Bill | Dollar Change | Percent Change | |
|
Single Family |
$656,800 |
$3,445 |
$660,100 |
$3,564 |
$119 |
3.45% |
|
Condominium |
$363,050 |
$1,224 |
$365,950 |
$1,293 |
$ 69 |
5.64% |
|
Two Family |
$654,900 |
$3,430 |
$648,800 |
$3,477 |
$ 47 |
1.37% |
|
Three Family |
$742,300 |
$4,091 |
$733,700 |
$4,132 |
$ 41 |
1.00% |
* Includes Residential Exemption
CITY-WIDE ASSESSED VALUES
FY10 values are based on market activity that occurred during calendar year 2008, during which the overall valuation of the City's residential property increased by a modest 1.7% and the overall valuation of commercial property increased by 1.6%. This reflects a leveling of commercial rental rates and a slight increase in commercial vacancies. This has had a slight impact on existing commercial property values. The major component of the increased commercial value, however, continues to be new construction of life science buildings and the personal property associated with these developments.
For several years prior to FY06, escalating residential values outpaced increases in commercial values, resulting in a shift of the tax burden from commercial to residential property owners. However, in FY06, this trend reversed. In FY10 the market for both commercial and residential properties remained level, resulting in the continuation of a tax burden similar to FY09 between commercial taxpayers and residential taxpayers.
For FY10, the total assessed value of taxable property in the City of Cambridge equals $24,271,700,606, a 1.7% increase over FY09 values. The tables below break out new construction value and tax base levy growth due to new construction by property type. This new construction growth has resulted in a further shift in taxes for the fifth year in a row and an increase in the City's excess levy capacity.
TABLE III
New Construction Breakdown in FY10
|
Property Class |
New Value |
FY10 Tax Base Levy Growth (New Growth) |
|
Commercial Property |
$ 195,585,200 |
$ 3,514,666 |
|
Personal Property |
$ 224,833,190 |
$ 4,040,252 |
|
Residential Property |
$ 295,570,725 |
$ 2,234,515 |
|
Total New Growth |
$ 715,989,115 |
$ 9,789,433 |
TABLE IV
Assessed Values (in millions)
|
|
FY06 |
FY07 |
FY08 |
FY09 |
FY10 |
|
Commercial Property |
$7,280 |
$7,372 |
$8,378 |
$ 8,457 |
$ 8,467 |
|
Personal Property |
$605 |
$659 |
$736 |
$768 |
$911 |
|
Residential Property |
$13,962 |
$14,136 |
$14,427 |
$14,651 |
$14,894 |
|
Total Assessed Value |
$21,847 |
$22,167 |
$23,541 |
$23,876 |
$24,272 |
For FY10, the City was able to increase its levy limit by approximately $20 million, to $367.2 million. Approximately $9.8 million of this increase was due to new construction. State law allows the City to increase its tax levy limit by an amount equal to the total FY10 value of newly constructed or renovated property multiplied by the FY09 tax rate. The remaining $10.2 million is the 2.5% increase over the FY09 levy allowed by Proposition 2½, plus a revised new value calculation from FY09. The City's excess levy capacity increased by $5.9 million, or 6.4%, to $98,6 million in FY10.
TABLE V
Tax Levy/Tax Levy Limit/Excess Levy Capacity
(in thousands)
| Actual FY06 | Actual FY07 | Actual FY08 | Actual FY09 | Estimated FY10 | |
| Levy Limit | $288,048 | $305,445 | $330,587 | $347,606 | $367,222 |
| Actual Levy | $222,960 | $231,787 | $242,334 | $254,946 | $268,663 |
| % Actual Levy Increase over Prior Year | 0% | 3.96% | 4.55% | 5.20% | 5.38% |
| Excess Levy Capacity | $65,088 | $73,658 | $88,253 | $92,660 | $98,559 |
| % Actual Excess Levy Capacity Increase Over Prior Year |
45.6% | 13.2% | 19.8% | 5.0% | 6.4% |
In addition to providing greater flexibility under Proposition 2½, tax payments from newly constructed properties also work to mitigate increases on existing properties.
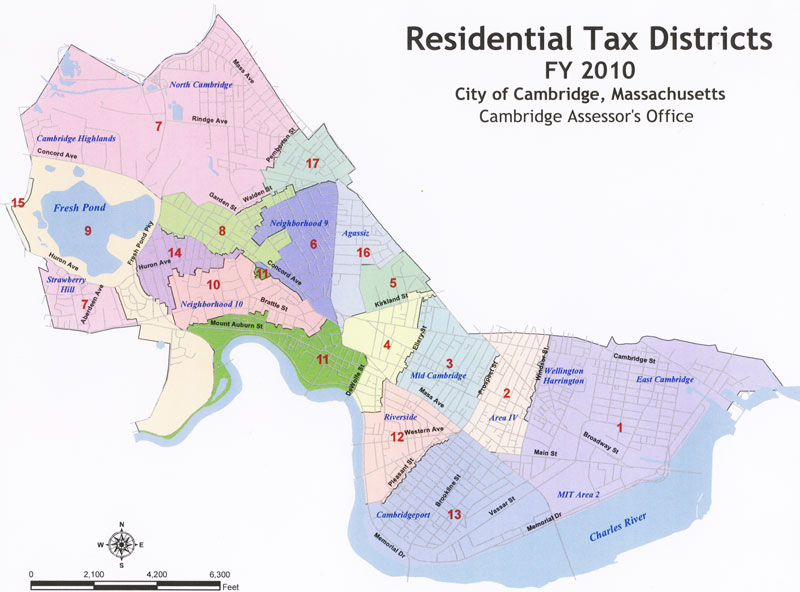
For a detailed listing of assessment changes by district, please see Attachment 1.
FY10 VALUATION PROCESS
Each year, the Board of Assessors conducts a reappraisal of all property within the City of Cambridge using the residential and commercial valuation models first introduced in FY05. The City chose FY05 to coincide with the Commonwealth of Massachusetts Department of Revenue (DOR) triennial mass appraisal review and certification process to ensure a complete and thorough review of the new valuation models. Since that time, the model has been refined each year to reflect market conditions which have impacted assessed values. In FY08, the DOR conducted its triennial review and certification and once again it certified the City's valuation models after a vigorous review.
The FY10 valuation model is based upon sales of property that occurred during calendar year 2008 to establish the market value of all property as of January 1, 2009. For FY10, the number of assessing districts has remained unchanged. In prior years, some consolidation of districts took place to create a larger sales sample size.
The ultimate test for any mass appraisal model is the comparison between actual sales not part of the model building process and the predicted value from the model. Comparing the FY09 model to calendar year 2008 sales data, the model showed the following results:
TABLE VI
Residential Sales Price/Assessment Comparison
|
Property Type |
Sale Count |
Median Sale Price |
Median Assessment |
|
Single Family |
101 |
$810,000 |
$740,000 |
|
Two Family |
58 |
$650,000 |
$650,450 |
|
Three Family |
23 |
$845,000 |
$780,900 |
|
Condominiums |
647 |
$405,000 |
$367,800 |
The assessment ratios were at 91-97% of calendar year 2008 sales, which means that assessed estimate of values for FY09 were below actual market sales.
Although the calendar year 2008 sales demonstrated that the FY09 model was an accurate representation using overall property class statistics, the individual neighborhoods were not as consistent and required review. As a result, FY10 sales data from the calendar year 2008 real estate market has been utilized, along with what was learned from the prior year abatement activity, to establish the FY10 assessed values as of January 1, 2009. Using technologies, such as the Geographical Information System (GIS), allowed for a more in-depth review of data. Using GIS, the Board of Assessors was able to visually display the market activity and thereby validate the assessing districts using this information. For FY10, the number of assessing districts remained at 17, which allowed for adequate sample sizes for the neighborhoods.
Modifications were made which included lowering of the base rate for two and three-family homes. In addition, approximately 3,850 inspections were completed along with a detailed field review of property. These inspections serve to ensure consistency within neighborhoods and across the City. The analysis for determining property values depends on several factors: the trends of the real estate market in the areas of sales; property improvements; changes in the economics of real estate finance; and the high demand for real estate in the City. To arrive at full and fair cash values for approximately 23,900 parcels. the Assessing Department uses a state-of-the-art Computer Assisted Mass Appraisal system (CAMA). Market adjusted cost approach models, extracted from residential sales for calendar year 2008, were refined to best reflect the equity of comparable properties as demonstrated in the various neighborhoods. Sales of 829 houses and condominium units were analyzed to develop these valuation models by property type (one-family, two-family, three-family, and condominium units). The FY10 real property assessments reflect the resultant analysis of the real estate market for the calendar year 2008.
COMMUNITY PRESERVATION ACT SURCHARGE
In November 2001, Cambridge voters approved adoption of the Community Preservation Act (CPA), a State law that allows the City to receive matching funds from the State for money raised locally in support of affordable housing, historic preservation and protection of open space. The local portion of CPA funding is raised through a 3% surcharge on taxes. To date, the City has appropriated/reserved a total of $92.2 million in CPA funds. The City has received $38.3 million in state matching funds through FY09 and expects to receive an additional $1.8 million in October 2009. It should be noted that this is the second year that the City will not receive a 100% state match, which is a result of additional communities participating in CPA and a reduction in the CPA Trust Fund collections through the Registry of Deeds. The FY10 state match to be received by the City is estimated at 29%, which is a decrease from 65% received in FY09.
The CPA surcharge has an essentially neutral impact on tax bills because funding of affordable housing and historic preservation initiatives has been shifted from the tax levy to the surcharge. The City continues to allocate a similar amount of local funds to these initiatives. However, the State match has enabled the City to leverage the amount of funding appropriated for these initiatives. To date, Cambridge has received more CPA matching funds from the Commonwealth than any other participating community. Consequently, Cambridge residents will benefit from important housing, historic preservation and open space initiatives throughout the City for years to come.
TABLE VII
Community Preservation Act Surcharge
|
|
FY09 Median CPA |
FY10 Median CPA |
FY10 |
FY10 Median Tax & |
|
Single Family |
$81 |
$84 |
$3,564 |
$3,648 |
|
Condominium |
$14 |
$16 |
$1,293 |
$1,309 |
|
Two Family |
$80 |
$81 |
$3,477 |
$3,558 |
|
Three Family |
$100 |
$101 |
$4,132 |
$4,233 |
RECOMMENDATIONS
1. That the City Council authorize the use of Free Cash, of $9,000,000, to reduce the FY10 tax rate.
2. That the City Council vote to authorize $2,000,000 in overlay surplus/reserve be used for reducing the FY10 tax levy.
3. That the City Council vote to authorize $8,000,000 from the Debt Stabilization Fund be used as a revenue source to the General Fund Budget, which was included in the FY10 Adopted Budget.
4. That the City Council vote to authorize $2,795,770 from the School Debt Stabilization Fund be used as a revenue source to the General Fund Budget, which was included in the FYI 0 Adopted Budget.
5. That the City Council classify property within the City of Cambridge into the five classes allowed for the purpose of allocating the property tax. It is further recommended that the City Council adopt a minimum residential factor of 56.3213%.
6. That the City Council approve the maximum residential exemption factor of 30% for owner occupied homes, which should result in a residential tax rate of $7.72 and commercial tax rate of $18.75 upon final approval by the Massachusetts Department of Revenue.
7. That the City Council vote to double the normal value of the statutory exemptions.
8. That the City Council vote to increase the FY09 exemption allowed under Massachusetts General Laws (MGL) Chapter 59, Section 5, Clause 17D from $271.00 to $280.00.
9. That the City Council vote to increase the FY09 asset limits allowed under Massachusetts General Laws (MGL) Chapter 59, Section 5, Clause 17E from $53,889 to $55,775.
10. That the City Council vote to increase the FY09 income and assets limits, Income limits of $22,281 to $23,061 for those who are single and $33,422 to $34,592 for those who are married, asset limits of $44,562 to $46,122 for those who are single and $61,273 to $63,418 for those who are married, as allowed under MGL. Chapter 59, Section 5, Clause 41D.
11. That the City Council vote to increase the income limit for deferral of real estate taxes by elderly persons (at least 65 years old) from $40,000 to the amount determined by the Commissioner of Revenue for the purposes of subsection (k) of section 6 of chapter 62, for a single person who is not head of household ($51,000), as allowed under MGL Chapter 59, Section 5, Clause 41A.
12. That the City Council vote to adopt MGL Chapter 59, Section 5, Clause Fifth C, which increases the exemption for real and personal property held for the benefit of incorporated organizations of veterans of any war in which the United States has been engaged, to the extent of $1,500,000 if used and occupied by such association.
ISSUES/REQUIRED VOTES
As the City Council is aware, by the time the classification vote is taken in the Fall of each year, the options for the City are fairly limited. Failure to approve the recommended classification, residential exemption and the doubling of statutory exemptions would result in significantly higher taxes for residential property owners. After the classification vote is taken, the establishment of the tax rate is a fairly simple mathematical calculation: the tax levy required to support the City budget divided by the total assessed valuation equals the tax rate for FY 10.
The following is a summary of the required votes required by the City Council.
The $9,000,000 in the Free Cash authorization is requested at this time from the City's Free Cash balance in order to reduce the property tax levy increase, which is the same amount used last year.
The Department of Revenue (DOR) does not allow formal authorizations of Free Cash by the City Council until the DOR has certified a Free Cash balance at the conclusion of the fiscal year.
Transfer of Excess Overlay Balances. The City is authorized to increase each tax levy by up to five percent as an “overlay” to provide for tax abatements. If abatements are granted in excess of the applicable overlay, the excess is required to be added to the next tax levy or transfers may be made from surplus balances from prior fiscal years.
Overall, the City has approximately $14.6 million in overlay balances as of June 30, 2009. However, there are cases pending at the Appellate Tax Board for which the City must have sufficient balances to cover abatements if it loses these cases. Based upon the overall size of the overlay surplus, I am recommending that the City use $2 million of this surplus to decrease the tax levy. Based on the level of the current surplus, the City would continue to use $2 million for this purpose in future years. This conservative approach will allow the City to maintain a sufficient overlay reserve while reducing older overlay balances to help lower the tax levy.
Authorize $8,000,000 in Debt Stabilization Funds. In recognition
of increases in debt service costs related to major capital projects. the
City established a Debt Stabilization Fund and has made contributions to it
over the past several years. The balance in this Stabilization Fund is
approximately $21.1 million as of June 30, 2009. The Adopted FY10 Budget
included $8.0 million from this source to fund increases in debt service
costs.
Authorize $2,795,770 in School Debt Stabilization Funds. In
recognition of increases in debt service costs related to major capital
projects, the City established a School Debt Stabilization Fund and has made
contributions to it over the past several years. The balance in this
Stabilization Fund is approximately $9.9 million as of June 30, 2009. The
Adopted FY10 Budget included $2,795,770 from this source to fund increases
in debt service costs for the War Memorial and to cover the drop-off in
School Building Authority reimbursements prior to the completion of the
principal and interest payments for elementary school projects.
Classify Property and Establish Minimum Residential Factor. Since 1984, the City Council has voted annually to follow State law allowing the classification of property according to use (residential or commercial) and to allocate the legal maximum portion of the tax levy to the commercial class. State law allows the residential portion of the tax levy to be as low as 50% of what it would be if there were single tax rates, However, there are two exceptions to the 50% minimum:
The residential percent of the levy cannot drop to less than its lowest level since classification was initially voted by the City Council (34.5615% in 1985 in Cambridge); and the 50% level does not cause the commercial class to bear a portion of the levy greater than 175% of what it would be if both classes were taxed equally; and
The City Council sets the levy distribution each year by voting for a Minimum Residential Factor. The result of voting for the Minimum Residential Factor of 56.3213% this year will be a residential property share of the total tax levy of 34.5615%, Commercial property will pay 65.4385% of the levy, which brings the commercial portion of the levy to 169% of what would be with a single tax rate.
Residential Exemptions. Home Rule Legislation allowing the City of Cambridge to increase the residential exemption from 20% to 30% was filed by a unanimous vote of the City Council and signed into law in September 2003. This change enables the City to grant owner occupants of residential properties a deduction of up to 30% of the average residential parcel value before the tax rate is applied. I am recommending that the City Council accept the Maximum Residential Exemption of 30%. This amount is deducted from the assessed value of each owner occupied property prior to applying the tax rate. The residential exemption serves to reduce the effective tax rate on lower valued properties while raising it on higher valued properties. Since the same amount is deducted from every value, its impact is greatest on the lower valued properties. The residential exemption is paid for by raising the residential tax rate sufficiently to cover the number of taxpayers claiming the residential exemption.
For FY10, there are approximately 14,450 residential exemptions on the Assessing Department files. Overall, 91% of the owner occupied homes benefit from the 30% residential exemption.
If Cambridge did not adopt a residential exemption, the residential tax rate would be $6.23 instead of $7.72. The higher tax rate results in a "break-even" value over which the higher valued residential properties are assessed for higher taxes than would be the case if there were no residential exemption. In FY10, the break-even assessed value is approximately $1,030,000.
30% Residential Exemption
|
|
FY2008 |
FY2009 |
FY2010 |
|
Value Exempted |
$202,151.00 |
$201,161.00 |
$198,423.00 |
|
Tax Savings |
$1,487.83 |
$1,520.78 |
$1,531.83 |
Double Statutory Exemptions/Exemption Increases. State legislation requires cities and towns to grant a variety of tax exemptions to elderly taxpayers, blind taxpayers, veterans, and surviving spouses who qualify by virtue of residency, income and assets. There are also two pieces of legislation which authorize cities and towns to increase the amounts of these exemptions.
The first allows cities and towns to double the statutory amount of exemption for taxpayers whose tax bills have increased over the prior year's bill. The City Council must vote annually for this increase. I am recommending that the Council do this for FY10, as it has since FY87.
The second allows cities and towns under Massachusetts General Laws (MGL) Chapter 59, Section 5, Clause 17D to increase the amount of the exemption for a senior citizen 70 or older, surviving spouse, or minor with a deceased parent by the increase in the cost-of-living as measured by the Consumer Price Index (CPI).
The CPI increase for FY10, which was published by the DOR for exemption purposes, is 3.5%. Applying this percentage increase to the FY09 exemption of $271 raises the exemption to $280. In addition, under Clause 17E, cities and towns can increase the asset amounts by the CPI percentage for this same group which would mean an increase from $53,889 to $55,775.
MGL, Chapter 59, Section 5, Clause 41D allows cities and towns to increase the income and assets limits for elderly persons (age 65 or older) by the CPI percentage. This would increase income limits from $22,281 to $23,061 for those who are single and $33,422 to $34,592 for those who are married, and would increase asset limits of $44,562 to $46,122 for those who are single and $61,273 to $63,418 for those who are married.
Income Limit for Tax Deferral. Another form of tax relief
available to property owners under state law is found in MGL, Chapter 59.
Section 3 Clause 41A. This statute allows taxpayers who are at least 65
years old to defer tax payment until they are deceased or the property is
transferred. The statutory income limit for this deferral is $40,000.
However, there has been a change in the statute, which allows the City
Council to vote to increase the income limit for deferral of real estate
taxes by elderly persons (at least 65 years old) from $40,000 to the amount
determined by the Commissioner of Revenue for the purposes of subsection (k)
of section 6 of chapter 62, ($51,000 for 2008, which will be indexed
yearly), as allowed under MGL Chapter 59, Section 5, Clause 41A. I am
recommending that the City Council vote to adopt this increased deferral
amount.
Increased Exemption for Veterans Organizations. The Legislature adopted legislation in 2008 to increase the exemption amount for veteran organizations from $700,000 to $1,500,000 related to personal and real property assessments. I am recommending that the City Council vote to adopt MGL Chapter 59, Section 5, Clause Five C, which increases the exemption for real and personal property held for the benefit of incorporated organizations of veterans of any war in which the United States has been engaged, to the extent of $1,500,000 if used and occupied by such association. With this acceptance, this will ensure the continuation of the exemption of personal and real estate taxes for veteran organizations in the City.
CONCLUSION
In May, the City Council adopted a FY10 Budget which: 1) maintains City and school services that citizens have come to expect and provides for a strong capital plan, while providing the stability and reinvestment in our community that is important during these difficult times. This fact should not be lost, given the current economic climate and the fiscal challenges facing many cities and towns in the Commonwealth; 2) provides full funding to support programmatic and operational costs for the two facilities that opened during FY09 (War Memorial Recreation Center and the Public Safety Facility), and the two that were recently completed (West Cambridge Youth and Community Center and the Main Library); 3) provides financing for major renovations to Cambridge Rindge and Latin High School which began in June 2009; and 4) achieves the above with a moderate increase in the property tax levy, in spite of a significant reduction in State Aid from FY09 levels, while supporting the City Council Goal of “evaluating expenditures with a view of maintaining a strong fiscal position and awareness of the impact on taxpayers.” Overall, the FY10 Budget has increased by 2%, which is the smallest increase in several years.
Approximately 61% of the revenues that fund the City's budget are raised through property taxes. Massachusetts communities are limited in how they can raise revenues, resulting in a greater reliance on the property tax, since it is the largest and most stable revenue. The City of Cambridge has been able to achieve a lower property tax rate and lower residential property tax bill than surrounding communities due to its ability to generate diverse non-property tax revenues, foster new construction, control budget growth and plan prudent use of reserves. These qualities benefited the City during good economic times but, equally as important, they have allowed the City to weather the current economic climate more favorably than other communities.
Overall, continued sound financial management and planning have enabled the City Council to limit the growth of residential property taxes in FY10, despite a $9.7 million reduction in State Aid. In addition, with City Council approval the City will use $19 million of Free Cash, overlay reserve and debt stabilization in FY10 to lessen the amount to be raised from the property tax levy, which translates into a lower property tax burden for the taxpayers of the City.
I believe that lessening the tax burden on our taxpayers is a prudent use of the City's reserve balances that we have created over the years, while maintaining our fiscal flexibility and continuing to position Cambridge as a favorable place to live and do business.
The FY10 property tax levy of $268,662,984 reflects a 5.38% increase. With approval of these recommendations, the five-year average increase of the property tax levy will be only 3.8%. As I noted earlier, the impact of the decrease in State Aid is the major factor creating the disparity between the percentage of budget increase and percentage of property tax levy increase.
In addition, approximately 80.5% of residential taxpayers will see a reduction, no increase or an increase of less than $100 in their FY10 tax bill, which is greater than our 4 year annual average and has occurred during a year of tremendous fiscal turmoil. This will be the fifth year in a row that a substantial majority of residential taxpayers will see either a reduction, no change or an increase of less than $100. This accomplishment is remarkable, given the current fiscal challenges.
Despite the economic crisis, the past fiscal year was another solid year for the finances of the City: with the excess levy capacity increasing, actual revenues above projections and increased total assessed values. While the City used approximately $21 million in Free Cash in FY09, it was able to replace all but $7.2 million which, based on the economic climate, is a major accomplishment.
This amount would have been lower by $2.6 million without the mid-year State Aid reduction. These strong financial indicators combined with a AAA credit rating provide the City with enormous flexibility to respond to the many needs facing this community, and to provide the services that the majority of our residents expect from the City without sacrificing our fiscal stability and flexibility. The strategic use of' Free Cash is not only used to reduce the tax levy, but is also available to fund one-time items. We have used a limited amount of our free cash balances in recent years to fund one-time capital projects. This planned approach has allowed us to maintain our Free Cash balances, which is especially important during these uncertain times.
Included in a separate recommendation are supplemental budget requests from Free Cash to support design costs related to the Harvard Square Tunnel and Harvard Square Street and Sidewalk reconstruction, provide funding for design services to replace the HVAC system at the Central Square Branch Library and support for a parenting education program based on the Harlem Children's Zone's Baby College. In addition, there may be other recommendations from Free Cash during the fiscal year, as has been the case in previous years.
There are some serious fiscal challenges that will affect the City both in the short and long-term.
While it appears that the current recession is bottoming-out, the majority of experts are predicting a slow economic recovery. Also, the State will have a better outlook of FY10 revenues sometime in October, once September revenues have been analyzed. Depending upon the results, the State may be facing current fiscal year budget reductions, which may include Local Aid reductions.
In addition, the FY09 and FY10 State Budget utilized Federal Stimulus Funds to offset additional budget reductions, which may result in a structural deficit moving forward as the State prepares for the FY11 Budget process. This potential deficit would have to be dealt with through replacement revenues, expenditure reductions or a combination of both.
During FY10 the City will receive the results of updated actuarial reports for its unfunded pension liability and other post employment benefits (OPEB). The City is aware of these obligations and has proactively planned to address them. In the case of our unfunded pension liability, the current actuarial report projects the liability to be met by 2013. This is well ahead of the 2030 deadline to fully fund the pension obligation. We expect the 2013 date will be pushed out when the new report is completed, based on the recent decline in the stock market from its highs in the Fall of 2007. The City will develop options to address the updated unfunded pension liability in a fiscally prudent manner as it has in the past. With regard to the OPEB liability, the OPEB Steering Committee will make recommendations to me, once the updated study is completed. The following potential funding sources, which have been discussed annually with the Rating Agencies, will continue to be reviewed to determine the best options. These options include: a transfer of principal and interest from the Health Claims Trust Fund; redirecting funds currently used to fund the unfunded pensions liability once fully funded; potential health insurance savings incurred during the fiscal year; and free cash appropriations.
It should be noted that the pension and OPEB liabilities are not unique to the City of Cambridge. These are obligations facing all other municipalities as well as the Commonwealth. However, I believe that Cambridge is in a better position to address these obligations in a logical and prudent manner.
The long-term outlook for Cambridge continues to be very strong as long as we strive to manage our resources wisely. We will continue to use our five year financial and capital plan and the City Council Goals as a blue print for our long-range planning.
While Cambridge is not insulated from current economic realities, we have positioned ourselves well by adhering to the proven fiscal policies that have served us effectively in the past to respond to these challenges in order to preserve the high level of municipal services that residents have come to expect, meet the needs of our infrastructure and ensure a stable fiscal future for Cambridge.
It is my belief that we have again collectively listened to the taxpayers and residents through our actions and have responded effectively.
Robert W. Healy
City Manager
Attachment 1
|
FY10 CONDOMINIUM ASSESSMENT DATA |
||||
|
NBHD |
Count |
FY09 |
FY10 |
Change |
|
R1 |
2,067 |
$408,100 |
$406,100 |
-0,49% |
|
R2 |
567 |
$329,200 |
$329,200 |
0.00% |
|
R3 |
1,972 |
$349,850 |
$348,800 |
-0.30% |
|
R4 |
647 |
$308,400 |
$315,300 |
2.24% |
|
R5 |
11 |
$1,126,500 |
$1,171,100 |
3.96% |
|
R6 |
1,589 |
$329,100 |
$330,300 |
0.36% |
|
R7 |
1,492 |
$337,300 |
$330,400 |
-2.05% |
|
R8 |
361 |
$439,900 |
$439,900 |
0.00% |
|
R9 |
42 |
$461,750 |
$461,750 |
0.00% |
|
R10 |
37 |
$1,269,700 |
$1,275,900 |
0.49% |
|
R11 |
515 |
$571,000 |
$588,500 |
3.06% |
|
R12 |
1,002 |
$352,950 |
$350,650 |
-0.65% |
|
R13 |
976 |
$357,300 |
$357,300 |
0.00% |
| R14 | 312 | $464,250 | $465,500 | 0.27% |
| R15 | 0 | - | - | - |
|
R16 |
351 |
$360,600 |
$360,600 |
0.00% |
|
R17 |
486 |
$429,800 |
$429,800 |
0.00% |
|
FY10 SINGLE FAMILY ASSESSMENT DATA |
||||
|
NBHD |
Count |
FY09 |
FY10 |
Change |
|
R1 |
393 |
$395,500 |
$396,900 |
0.35% |
|
R2 |
205 |
$411,700 |
$412,100 |
0.10% |
|
R3 |
222 |
$697,500 |
$699,800 |
0.33% |
|
R4 |
84 |
$787,150 |
$787,150 |
0.00% |
|
R5 |
56 |
$2,068,200 |
$2,088,600 |
0.99% |
|
R6 |
338 |
$1,277,350 |
$1,282,850 |
0.43% |
|
R7 |
649 |
$455,400 |
$456,300 |
0.20% |
|
R8 |
223 |
$618,800 |
$633,000 |
2.29% |
|
R9 |
203 |
$1,023,600 |
$1,027,800 |
0.41% |
|
R10 |
333 |
$2,500,900 |
$2,545,000 |
1.76% |
|
R11 |
164 |
$1,118,250 |
$1,118,250 |
0.00% |
|
R12 |
178 |
$528,550 |
$532,050 |
0.66% |
|
R13 |
233 |
$546,800 |
$550,100 |
0.60% |
|
R14 |
129 |
$960,500 |
$975,900 |
1.60% |
|
R15 |
32 |
$699,800 |
$707,050 |
1.04% |
|
R16 |
148 |
$821,950 |
$831,200 |
1.13% |
|
R17 |
179 |
$608,300 |
$608,300 |
0.00% |
|
FY10 TWO FAMILY ASSESSMENT DATA |
||||
|
NBHD |
Count |
FY09 |
FY10 |
Change |
|
R1 |
299 |
$453,000 |
$450,500 |
-0.55% |
|
R2 |
178 |
$495,200 |
$492,950 |
-0.45% |
|
R3 |
222 |
$817,700 |
$813,700 |
-0.49% |
|
R4 |
49 |
$966,600 |
$961,300 |
-0.55% |
|
R5 |
13 |
$2,121,600 |
$2,109,700 |
-0.56% |
|
R6 |
89 |
$1,117,100 |
$1,109,500 |
-0.68% |
|
R7 |
640 |
$590,250 |
$584,350 |
-1.00% |
|
R8 |
224 |
$685,350 |
$684,900 |
-0.07% |
|
R9 |
12 |
$835,150 |
$828,800 |
-0.76% |
|
R10 |
16 |
$1,994,450 |
$1,982,950 |
-0.58% |
|
R11 |
37 |
$1,183,000 |
$1,177,900 |
-0.43% |
|
R12 |
173 |
$607,900 |
$608,400 |
0.08% |
|
R13 |
238 |
$665,200 |
$662,600 |
-0.39% |
|
R14 |
223 |
$838,400 |
$837,200 |
-0.14% |
|
R15 |
0 |
- |
- |
- |
|
R16 |
92 |
$886,550 |
$868,600 |
-2.02% |
|
R17 |
143 |
$678,100 |
$674,500 |
-0.53% |
|
FY10 THREE FAMILY ASSESSMENT DATA |
||||
|
NBHD |
Count |
FY09 |
FY10 |
Change |
|
R1 |
243 |
$564,000 |
$560,700 |
-0.59% |
|
R2 |
156 |
$661,500 |
$654,950 |
-0.99% |
|
R3 |
132 |
$949,900 |
$942,700 |
-0.76% |
|
R4 |
35 |
$1,108,300 |
$101,400,400 |
-0.62% |
|
R5 |
4 |
$2,366,300 |
$2,539,150 |
7.30% |
|
R6 |
40 |
$1,262,000 |
$1,252,300 |
-0.77% |
|
R7 |
190 |
$702,050 |
$695,250 |
-0.97% |
|
R8 |
58 |
$885,000 |
$877,150 |
-0.89% |
|
R9 |
1 |
$584,800 |
$579,900 |
-0.84% |
|
R10 |
1 |
$3,096,200 |
$3,075,400 |
-0.67% |
|
R11 |
18 |
$1,184,250 |
$1,178,050 |
-0.52% |
|
R12 |
118 |
$726,700 |
$726,300 |
-0.06% |
|
R13 |
162 |
$721,000 |
$716,700 |
-0.60% |
|
R14 |
49 |
$892,700 |
$885,400 |
-0.82% |
|
R15 |
0 |
- |
- |
- |
|
R16 |
48 |
$915,600 |
$909,300 |
-0.69% |
|
R17 |
71 |
$798,200 |
$790,900 |
-0.91% |